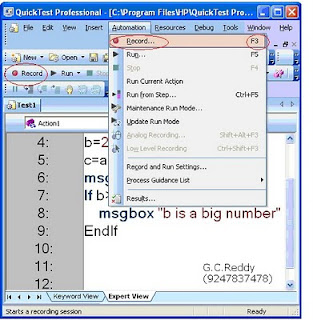
Key Elements of QTP Tool Window
1) Test Pane:
It is programming interface of QTP, used for creating, editing, viewing and deleting test scripts.
Test: It is a set of statements or set of one or more actions. (It is a local concept)
Action: It is a set of Statements. (It is a local concept)
Statement: A minimal executable unit. Statements may have keywords. (Keyword such as function, method, statement etc). It is a global concept.
Test pane has 2 views.
Expert view- Test in VB script format.
Key word view- Test in Icon based GUI format.
Note1: Here in test pane Test is same but views are different, if you perform any modifications in one view those automatically reflects in another view.
Note 2: Technical users use expert view and business user use key word view.
Note 3: User can customize Test pane view options.
Navigation: Tools Menu> view options> we can use font size and colors etc.
2) Active Screen
It has an optional element of QTP, it takes snap shots of every statement that user performed action or operation on AUT.
It can be used for understanding and editing the test easily.
Navigation: View menu>active screen (for launching and closing)
Configuring Active Screen: view>options>active screen tab>increase /Decrease capture level, apply and okay.
Note 1: Generally novice testers use this feature but it occupies lot of memory space on QTP.
3) Data Table
It has an integrated spread sheet (Excel like), used for Data driven testing.
Data driven Testing: Testing the same task(S) or same operation with multiple sets of test data.
It can be used in two ways.
1. Enter test data directly into Data Table and use.
2. Importing data from external files (Flat files, excel sheets, etc) and Data bases (MS access, Sql Server, oracle, etc.)
It has two types of sheets.
1). Global Sheet- for entire Test /used for all actions in the Test.
2). Action Sheets- for specific Action only.
Data table available in 2 ways:
1). Design time data table. (Attached with every test)
2). Run time data table. (Available in result window)
Run time is a carbon copy of design time data table.
QTP has Data table methods for performing operations on data table.
4) Debug Viewer
It is used for locating and rectifying or fixing errors.
It can be used for debugging the tests by step-by-step execution.
We use Step into, Step over and Step out commands for debugging. (debug commands)
Navigation: View menu>debug viewer (for launching and closing)
Through Debug viewer user can watch variables and change values of variables temporarily.
Through Debug viewer user can watch variables and change values of variables temporarily.
5) Missing Resources
It can be used for showing missing resources that attached to current test such as (Recovery Scenarios, Library files etc).
Navigation: View menu >missing resources (for launching and closing)
6) Information
This pane shows syntax errors automatically during saving the test.
7) QTP Commands
QTP Commands are available in 3 ways.
1). Menu options
2). Tool Bar options
3). Short cut keys (for Some important operations only)
QTP Tool Window Menus
File menu: Through file menu user can create, save tests, open existing tests, export tests in zip format.
Edit Menu: It provides editing options and renaming, deleting and splitting actions.
View menu: Through this menu we can launch and close, active screen, Data Table, Debug viewer, information, missing resources etc.
Insert Menu: Through this menu user can inserting check points, out put values, synchronizing points.
In this menu step generator available, using this user can generate recordable and non-recordable scripts.
Through insert menu user can insert VB Script conditional and loop statements and transaction points (Start and End).
Through insert menu user can create new actions, call existing actions and copy existing actions.
Automation Menu: This menu provides Record, Run options and Run setting options
Through this menu we can start normal recording, analog recording and Low level recording.
Through this menu we can stop recoding, running and also we run tests.
Resources Menu: This menu provides object repository and recovery scenarios options.
Through this menu we can create /modify/delete objects information and we can associate repositories.
Through this menu we can create, modify and delete recovery scenarios.
Debug Menu:
This menu provides debug commands for step by step execution.
Through this menu we can insert/remove/break points.
Tools Menu: This menu provides Tools settings option, view options and object identification configuration.
Through this menu we can set tool options as well as test pane view options.
In this menu object spy option available, through this we can get object's information.(Properties and values)
In this menu Virtual object option available; through this option we can create virtual objects.
Window Menu: This menu provides QTP tool window style settings.
Help Menu: This menu provides QTP help as well as VB Script help.
Through this menu we can contact technical support people and we can send feedback.
Through this menu we can check for updates and download or install directly.


No comments:
Post a Comment